- 登入
- 註冊


在接下來的文章,我們會開始撰寫我們的第一支策略,並且在頁面上顯示你的回測結果。那麼在開始撰寫策略之前,我們會有一些事前準備,因為我們需要準備歷史的股票數據才能分析回測。


因此,請先回到我們上一篇下載歷史資料的地方,將開源程式碼修改為以下範例:
from tech_analysis_api_v2.api import TechAnalysis
from tech_analysis_api_v2.model import *


import threading
import pandas as pd
from datetime import datetime, timedelta
import mplfinance as mpf


def OnDigitalSSOEvent(aIsOK, aMsg):
    print(f'OnDigitalSSOEvent: {aIsOK} {aMsg}')


def OnTAConnStuEvent(aIsOK):
    print(f'OnTAConnStuEvent: {aIsOK}')
    if aIsOK:
        event.set()


def OnUpdate(ta_Type: eTA_Type, aResultPre, aResultLast):

    if aResultPre != None:
        if ta_Type == eTA_Type.SMA:
            print(f'前K {str(aResultPre)}')
        if ta_Type == eTA_Type.EMA:
            print(f'前K {str(aResultPre)}')
        if ta_Type == eTA_Type.WMA:
            print(f'前K {str(aResultPre)}')
        if ta_Type == eTA_Type.SAR:
            print(f'前K {str(aResultPre)}')
        if ta_Type == eTA_Type.RSI:
            print(f'前K {str(aResultPre)}')
        if ta_Type == eTA_Type.MACD:
            print(f'前K {str(aResultPre)}')
        if ta_Type == eTA_Type.KD:
            print(f'前K {str(aResultPre)}')
        if ta_Type == eTA_Type.CDP:
            print(f'前K {str(aResultPre)}')
    if aResultLast != None:
        if ta_Type == eTA_Type.SMA:
            print(f'最新 Time:{aResultLast.KBar.TimeSn_Dply}, SMA:{aResultLast.Value}')
        if ta_Type == eTA_Type.EMA:
            print(f'最新 Time:{aResultLast.KBar.TimeSn_Dply}, EMA:{aResultLast.Value}')
        if ta_Type == eTA_Type.WMA:
            print(f'最新 Time:{aResultLast.KBar.TimeSn_Dply}, EMA:{aResultLast.Value}')
        if ta_Type == eTA_Type.SAR:
            print(f'最新 Time:{aResultLast.KBar.TimeSn_Dply}, SAR:{aResultLast.SAR}, EPh:{aResultLast.EPh}, EPl:{aResultLast.EPl}, AF:{aResultLast.AF}, RaiseFall:{aResultLast.RaiseFall}')
        if ta_Type == eTA_Type.RSI:
            print(f'最新 Time:{aResultLast.KBar.TimeSn_Dply}, RSI:{aResultLast.RSI}, UpDn:{aResultLast.UpDn}, UpAvg:{aResultLast.UpAvg}, DnAvg:{aResultLast.DnAvg}')
        if ta_Type == eTA_Type.MACD:
            print(f'最新 Time:{aResultLast.KBar.TimeSn_Dply}, DIF:{aResultLast.DIF}, OSC:{aResultLast.OSC}')
        if ta_Type == eTA_Type.KD:
            print(f'最新 Time:{aResultLast.KBar.TimeSn_Dply}, K:{aResultLast.K}, D:{aResultLast.D}')
        if ta_Type == eTA_Type.CDP:
            print(f'最新 Time:{aResultLast.KBar.TimeSn_Dply}, CDP:{aResultLast.CDP}, AH:{aResultLast.AH}, NH:{aResultLast.NH}, AL:{aResultLast.AL}, NL:{aResultLast.NL}')

def OnRcvDone(ta_Type: eTA_Type, aResult):
    if ta_Type == eTA_Type.SMA:
        for x in aResult:
            print(f'回補 {x}')
    if ta_Type == eTA_Type.EMA:
        for x in aResult:
            print(f'回補 {x}')
    if ta_Type == eTA_Type.WMA:
        for x in aResult:
            print(f'回補 {x}')
    if ta_Type == eTA_Type.SAR:
        for x in aResult:
            print(f'回補 {x}')
    if ta_Type == eTA_Type.RSI:
        for x in aResult:
            print(f'回補 {x}')
    if ta_Type == eTA_Type.MACD:
        for x in aResult:
            print(f'回補 {x}')
    if ta_Type == eTA_Type.KD:
        for x in aResult:
            print(f'回補 {x}')
    if ta_Type == eTA_Type.CDP:
        for x in aResult:
            print(f'回補 {x}')

def option():
    ProdID = input("商品代號: ")
    SNK = input("分K(1/3/5): ")
    STA_Type = input("指標(SMA/EMA/WMA/SAR/RSI/MACD/KD/CDP): ")
    DateBegin = input("日期(ex: 20230619): ")


    NK = eNK_Kind.K_1m
    if SNK == '1':
        NK = eNK_Kind.K_1m
    elif SNK == '3':
        NK = eNK_Kind.K_3m
    elif SNK == '5':
        NK = eNK_Kind.K_5m


    TA_Type = eTA_Type.SMA
    if STA_Type == 'SMA':
        TA_Type = eTA_Type.SMA
    elif STA_Type == 'EMA':
        TA_Type = eTA_Type.EMA
    elif STA_Type == 'WMA':
        TA_Type = eTA_Type.WMA
    elif STA_Type == 'SAR':
        TA_Type = eTA_Type.SAR
    elif STA_Type == 'RSI':
        TA_Type = eTA_Type.RSI
    elif STA_Type == 'MACD':
        TA_Type = eTA_Type.MACD
    elif STA_Type == 'KD':
        TA_Type = eTA_Type.KD
    elif STA_Type == 'CDP':
        TA_Type = eTA_Type.CDP


    return TechAnalysis.get_k_setting(ProdID, TA_Type, NK, DateBegin)

event = threading.Event()

def fetch_historical_data(prod_id, start_date, end_date):
    """
    根據提供的日期範圍抓取歷史成交資料。
    """
    ta = TechAnalysis(OnDigitalSSOEvent, OnTAConnStuEvent, OnUpdate, OnRcvDone)
    ta.Login('H124418422', 'steven123')  # Replace with your credentials
    event.wait()


    all_data = []

    # 生成日期範圍
    for single_date in pd.date_range(start=start_date, end=end_date):
        formatted_date = single_date.strftime("%Y%m%d")
        lsBS, sErrMsg = ta.GetHisBS_Stock(prod_id, formatted_date)
        if sErrMsg:
            print(f"Error on {formatted_date}: {sErrMsg}")
        else:
            for x in lsBS:
                data_point = {
                    'ProdID': x.Prod,
                    'Match_Time': x.Match_Time,
                    'Match_Price': x.Match_Price,
                    'Match_Quantity': x.Match_Quantity,
                    'Is_TryMatch': x.Is_TryMatch,
                    'BS': x.BS,
                    'Date': single_date  # 在每條資料中新增日期
                }
                all_data.append(data_point)

    df = pd.DataFrame(all_data)
    df['Formatted_Time'] = df.apply(lambda row: convert_time(row['Match_Time'], row['Date']), axis=1)
    return df


def convert_time(time_val, date_val):
    # 解析日期
    year = date_val.year
    month = date_val.month
    day = date_val.day
    # 轉成STR比較好處理
    time_str = str(time_val)

    time_str = time_str[:6]
    if '.' in time_str:
        time_str = time_str.replace('.', '')
        time_str = '0' + time_str


    # 解析時間 小時、分鐘、秒
    hours = int(time_str[:2])
    minutes = int(time_str[2:4])
    seconds = int(time_str[4:6])
    # 返回datetime物件
    return datetime(year, month, day, hours, minutes, seconds)


def aggregate_to_ohlc(df, time_frame='5T'):
    """
    將給定的DataFrame轉換為指定時間幀的OHLC數據,並使用最後一個有效時間點的數據填充空白時間段。


    參數:
    df -- 原始的DataFrame。
    time_frame -- 要聚合的時間幀,默認為'5T'(五分鐘)。


    返回:
    轉換後的DataFrame,包含OHLC和總交易量。
    """
    df['Formatted_Time'] = pd.to_datetime(df['Formatted_Time'])
    df.set_index('Formatted_Time', inplace=True)


    # 定義聚合成OHLC的規則
    ohlc_dict = {
        'Match_Price': 'ohlc',
        'Match_Quantity': 'sum'
    }


    # 聚合資料
    df_ohlc = df.resample(time_frame).apply(ohlc_dict)
    df_ohlc.columns = df_ohlc.columns.droplevel(0)  # 移除多级列名


    # 13:25 並不會有交易,所以使用前一筆的資料填補
    df_ohlc.fillna(method='pad', inplace=True)

    # Remove data not between 9:00-13:30
    df_ohlc = df_ohlc.between_time('09:00', '13:30')
    # remove data from holidays
    df_ohlc = df_ohlc[df_ohlc.index.dayofweek < 5]


    return df_ohlc


def main():
    end_date = pd.to_datetime("today")
    start_date = end_date - pd.DateOffset(months=1)


    df = fetch_historical_data(prod_id='2454',start_date=start_date, end_date=end_date)
    if df is not None:
        df_ohlc = aggregate_to_ohlc(df, time_frame='5T')
        print("---------印出OHLC資料---------")
        print(df_ohlc)
    if df_ohlc is not None:
        # 確保你的 DataFrame 索引是日期時間型別(datetime)
        df_ohlc.index = pd.to_datetime(df_ohlc.index)


        # 交易量欄位重新命名為 volume (mplfinance 預設欄位名稱)
        df_ohlc.rename(columns={'Match_Quantity': 'volume'}, inplace=True)
        # 儲存為CSV檔案
        # df_ohlc.to_csv("2330_ohlc.csv")
        df_ohlc.to_csv("2454_ohlc.csv")
        print("OHLC資料已儲存為CSV檔案")
        mpf.plot(df_ohlc, type='candle', style='charles',
                title='245', volume=True)
main()
關於上述的程式碼改動,基本上就是抓取比更多天的資料,並且去除掉不必要的資料,以及將資料輸出成 CSV 檔案。
所以開始運行後,我們會有一個「2454_ohlc.csv」檔案。
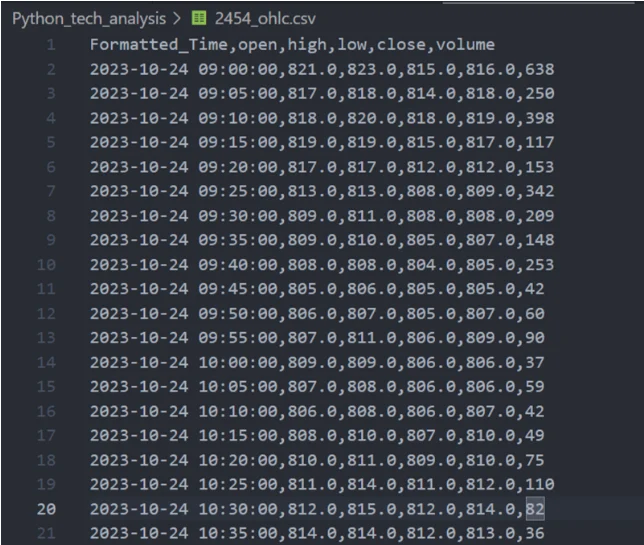
這個檔案是過去一個月,聯發科每五分鐘開高收低(ohlc)的價格,整理在一起的資料。
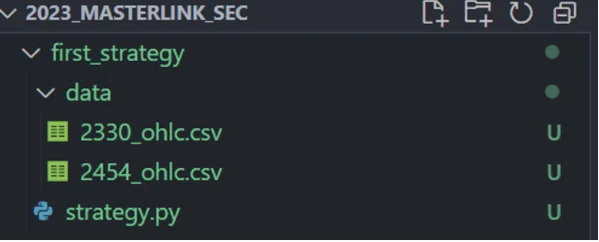
接下我們回到第一篇和第二篇文章所建立的環境底下,建立一個名為「first_strategy」的資料夾,並且在底下新增一個「data」供我們放置資料,以及新建一個「strategy.py」的檔案。
新增完成後,待會我們會在這裡撰寫我們的第一支策略。
首先,我們先安裝「backtesting library」。
pip install backtesting接下來我們打開「strategy.py」貼入以下程式碼,寫一隻交叉均線的策略。
import pandas as pd
from backtesting import Backtest, Strategy
from backtesting.lib import crossover
from backtesting.test import SMA


class SmaCross(Strategy):
    n1 = 2 # 短期均線天數
    n2 = 10 # 長期均線天數
    stop_loss_percentage = 0.02  # 停損點設為入場價格的 2%
    take_profit_percentage = 0.04  # 利潤目標設為入場價格的 4%
    entry_price = 0  # 用於紀錄進場價格


    def init(self):
        close = self.data.Close
        self.sma1 = self.I(SMA, close, self.n1)
        self.sma2 = self.I(SMA, close, self.n2)


    def next(self):
        if not self.position:
            if crossover(self.sma1, self.sma2):
                self.buy()
                self.entry_price = self.data.Close[-1]  # 更新進場價格
            elif crossover(self.sma2, self.sma1):
                self.sell()
                self.entry_price = self.data.Close[-1]  # 更新進場價格
        else:
            stop_loss = self.entry_price * (1 - self.stop_loss_percentage)
            take_profit = self.entry_price * (1 + self.take_profit_percentage)


            # 檢查並執行停損或達到利潤目標
            if self.data.Close[-1] <= stop_loss or self.data.Close[-1] >= take_profit:
                self.position.close()
                self.entry_price = 0  # 重設進場價格


# 載入資料
df = pd.read_csv('data/2454_ohlc.csv', index_col='Formatted_Time', parse_dates=True)
df.columns = [col.capitalize() for col in df.columns]


# 設定 Backtest df是資料,SmaCross是策略, cash是初始資金, commission是手續費
bt = Backtest(df, SmaCross, cash=1000000, commission=.002)


# 執行你的策略
output = bt.run()
print(output)


# 繪圖展示執行結果
bt.plot()
關於上述的程式碼,它是一個基於簡單移動平均線(SMA)交叉的交易策略。
移動平均線是一種常用的技術分析指標,用於平滑價格數據並識別趨勢的方向。而在這個策略中,使用了兩條不同時間範圍的移動平均線,具體進出場邏輯如下:
移動平均線的設定:
進場邏輯:
出場邏輯:
這種基於移動平均線交叉的策略,是假設市場的趨勢將會延續,並試圖通過捕捉這些趨勢變化來賺錢。
一般來說,短期移動平均線相對於長期移動平均線更敏感,能夠更快地反映價格變動。所以當短期線穿越長期線時,它可能表明市場趨勢的轉變,從而觸發買入或賣出信號。
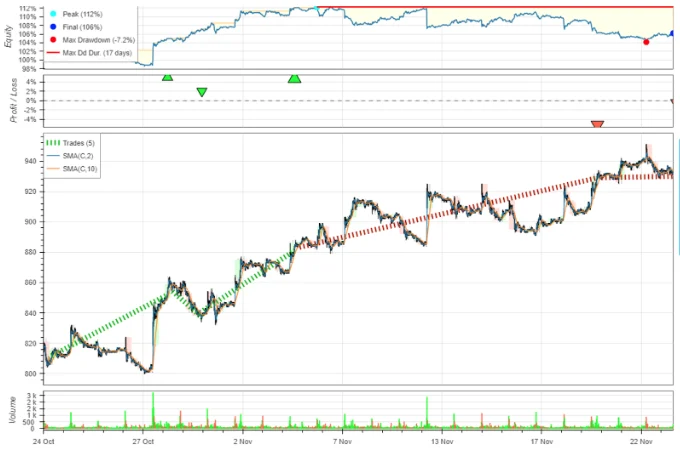
同時,在「terminal」 也可以看到這隻策略相關的交易報告:
Start                     2023-10-24 09:00:00
End                       2023-11-23 13:30:00
Duration                     30 days 04:30:00
Exposure Time [%]                   93.517787
Equity Final [$]                  1113824.842
Equity Peak [$]                   1118620.842
Return [%]                          11.382484
Buy & Hold Return [%]               13.970588
Return (Ann.) [%]                  207.144368
Volatility (Ann.) [%]               94.571445
Sharpe Ratio                         2.190348
Sortino Ratio                       13.515254
Calmar Ratio                        36.809133
Max. Drawdown [%]                   -5.627526
Avg. Drawdown [%]                   -0.780897
Max. Drawdown Duration       17 days 23:50:00
Avg. Drawdown Duration        0 days 22:37:00

Trades 7
Win Rate [%]                        71.428571
Best Trade [%]                       3.989552
Worst Trade [%]                     -4.341864
Avg. Trade [%]                       1.552014
Max. Trade Duration          10 days 23:20:00
Avg. Trade Duration           4 days 06:28:00
Profit Factor                        3.511277
Expectancy [%]                       1.590944
SQN                                  1.335834
_strategy                            SmaCross
_equity_curve                             ...
_trades                      Size  EntryBa...
關於交易報告提供相關解釋如下:
總結來說,以過去一個月的表現來看,這可以算是一隻不錯的策略。
透過上述的步驟,這樣我們就完成交易策略的撰寫與回測了!但請注意,如果要將此策略套用在實戰交易中,建議還是要把回測區間拉大以及嘗試各種參數!